
One Bottle Cap, Many Systems: How We Built Product 360
A global consumer health company managed product data across many systems, including SAP, data lakes, shared files, and product specification sources. Zenithive partnered with its data and product teams to build Product 360, a unified view of product data covering bottle caps, plastic materials, raw materials, formulas, and finished goods. Our team designed ETL pipelines on Databricks, structured the processed data in Snowflake, applied data quality rules, and delivered Power BI dashboards on top. Stakeholders now work from one governed source of product insight.
Project Context
Product information at the client lived in many places: SAP ECC instances across regions, an R&D data lake, SharePoint files with supplier packaging data, and product specification systems. Each source served its own team. Together, they made it hard to see how a product's components, materials, formulas and market data connect.Fintech Evolution had reached a point where legacy banking infrastructure was limiting product velocity, scalability, and operational efficiency. Years of incremental changes had created tightly coupled services, increasing deployment complexity and slowing the introduction of new financial products.This project was part of a major judicial modernization initiative aimed at improving transcription accuracy and turnaround time across courts handling multilingual proceedings.
The client set out to create a single Product 360 view. Zenithive designed and delivered the data engineering and business intelligence foundation for it. The platform brings data from multiple sources into one layered architecture, applies accuracy and coverage checks, and serves the results to dashboards and downstream applications.
Objectives & Success Criteria
Business Objectives
- Give stakeholders a unified 360-degree view of product data, including bottle caps, plastic materials, raw materials, formulas and finished goods.
- Support decisions on marketplace trends, supply chain analytics and material sourcing through business-level dashboards.
- Build confidence in product data through clear accuracy and coverage rules.
Technical Criteria
- Integrate data from multiple source systems into one platform.
- Transform raw data into business-ready datasets through defined processing layers.
- Streamline ETL workflows with automated orchestration and CI/CD.
- Monitor data quality and alert teams when issues appear.
Key Challenges
A Fragmented Source Landscape
Product data came from SAP ECC systems, data lakes, shared files and product specification sources. Each source had its own structure and refresh pattern.
Raw Data Not Ready for Business Use
Teams needed cleansed, standardized, and aggregated source data before they could use it for analytics and reporting.
Data Quality & Trust
Decision-makers needed to know whether product data was accurate and complete, so the platform had to measure both.
Solution Overview
Zenithive built Product 360 on Databricks and Snowflake. Databricks ingests and transforms data through three layers: L0 (raw), L1 (transformed), and L2 (business aggregated). Snowflake stores the processed data in a Raw, Core Integration and Core Access structure. DBT manages transformation workflows and CI/CD. Airflow DAGs trigger data movement and transformations. Power BI dashboards draw on Core Access data.
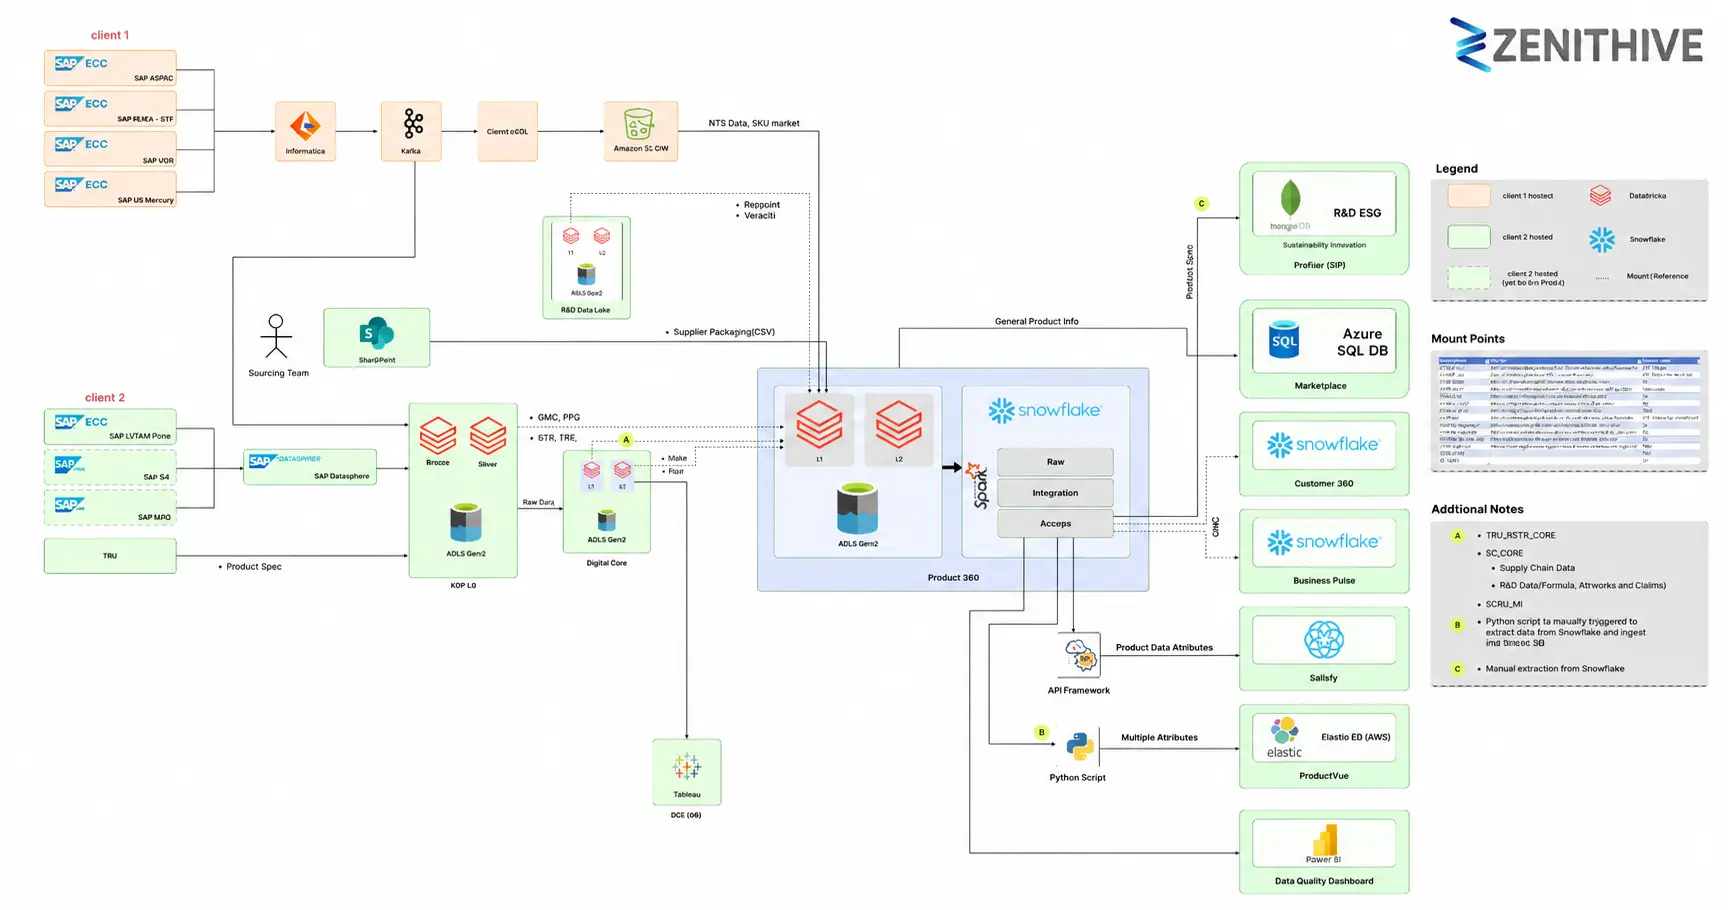
Systems Components & Capabilities
Layered Processing
Databricks pipelines move data from L0 to L1 and L2. The team used PySpark, SQL and Python at L2 to prepare data for BI.
Source Connectivity
The team connected Databricks to source systems through a Service Principal and mount points.
Snowflake Model
A three-layer structure organizes processed data into Raw, Core Integration and Core Access. Pipelines load data using truncate-and-load and overwrite methods.
Orchestration & CI/CD
Airflow DAGs trigger data movement and transformations. The team implemented DBT for transformation workflows and CI/CD within the Data Covers framework.
Data Quality
Alerting built on Data Quality Index (DQI) rules for accuracy and coverage flags data quality issues.
BI Dashboards
Power BI dashboards use Core Access data to show marketplace trends, supply chain analytics and material sourcing.
Databricks Workflow Orchestration
A master Databricks job coordinates the pipeline. It runs a preprocessing step, refreshes L1 in two batches, then runs the L2 refresh and core deliverable tasks. It finishes with postprocessing and a Snowflake data refresh. Within the L1 refresh, dependent notebook tasks process product hierarchies, ERP data, NTS data, SKU market data, certifications, goals, bills of materials and sustainability connectivity.
Technology Stack & Tools
Data Plateforms
Databricks
Snowflake
Azure
Ingestion & Connectivity
Informatica
Kafka
SAP Datasphere
Amazon S3
Transformation
PySpark
SQL
Python
DBT
Orchestration
Airflow
Databricks Workflows
BI & Delivery
Power BI
Tableau
Execution Approach
Phase 1: Source Integration & Foundation
Connected Databricks to the source systems through a Service Principal and mount points, and ingested raw data into the L0 layer.
Phase 2: Transformation & Business Layers
Built Databricks pipelines to move data from L0 to L1 and L2, using PySpark, SQL and Python to prepare business-ready datasets.
Phase 3: Snowflake Modeling, Orchestration & Quality
Established the Raw, Core Integration and Core Access layers in Snowflake. Implemented DBT workflows and CI/CD, Airflow orchestration, and DQI alerting for accuracy and coverage.
Phase 4: Dashboards & Insight Delivery
Built Power BI dashboards on Core Access data for marketplace trends, supply chain analytics and material sourcing.
Results & Business Impact
A Unified Product 360 View
Stakeholders gain insight across product components such as labels, formulas, plastics and chemicals in one platform.
More Streamlined ETL
Layered, orchestrated pipelines bring structure to how data moves from source systems to reporting.
Stronger Data Quality Practices
Accuracy and coverage rules, together with DQI alerting, help teams identify data issues.
Actionable BI Reporting
Power BI dashboards present marketplace trends and operational insight to business teams.
A Foundation Built to Scale
Airflow orchestration and a layered architecture give the platform a structure that can grow with new data sources and consumers.
Key Learnings
Layers Create Clarity
Separating raw, transformed and business-aggregated data made pipelines easier to manage and datasets easier to understand.
Quality Belongs in the Pipeline
Building accuracy and coverage rules into the workflow made data quality part of everyday operations rather than a later check.
Delivery Team
Zenithive deployed a 12-member team over 12 months. Roles: Data Engineers, BI Analysts, Architect, Technical Product Owner, BI Developer, QA Specialist, Scrum Master, CI/CD Developer.
Related Capabiities

Product data is never just about pipelines. It’s about decisions teams can trust.
If you’re connecting fragmented product or supply chain data, let’s compare contexts.
Frequently Asked Questions
How long does a project like this take, and who works on it?
This project ran for 12 months with a team of 12. The team included data engineers, BI analysts, an architect, a technical product owner, a BI developer, a QA specialist, a scrum master and a CI/CD developer. Timelines for other projects depend on the number of sources, the data complexity and the reporting needs.
How do Databricks and Snowflake work together in a data platform?
In this project, Databricks ingests raw data and transforms it through layers. Snowflake stores the processed data in a Raw, Core Integration and Core Access structure. Power BI dashboards then read from the Core Access layer.
What are L0, L1 and L2 data layers?
They are processing stages that move data from raw to business-ready. L0 holds raw data, L1 holds transformed data, and L2 holds business-aggregated data. Zenithive used PySpark, SQL and Python at L2 to prepare data for BI.
How does DBT fit into an ETL workflow?
DBT manages transformation workflows. On this project, the team also used it for CI/CD within the Data Covers framework. Airflow DAGs triggered the data movement and transformations around it.
How do you monitor data quality in a data pipeline?
The team built alerting on Data Quality Index (DQI) rules for accuracy and coverage. When data fails those rules, the system flags it. This helps teams find and fix issues before they reach reporting.
How does Airflow orchestrate data pipelines?
Airflow uses DAGs (directed acyclic graphs) to define the order of tasks. In this project, Airflow DAGs trigger data movement and transformations. Databricks workflows also coordinate the L1 and L2 refreshes and the Snowflake data refresh.