
From Spreadsheets to Signal: How We Automated Healthcare Ad Analytics
A healthcare advertising company managed patient engagement and ad performance data in Excel spreadsheets. The process was slow, prone to errors and limited in the depth of analysis it could support. Zenithive partnered with its team to replace it with an automated data platform. Our team designed the ingestion, transformation and orchestration pipelines on AWS S3, Fivetran, Snowflake, DBT and Airflow, added data cataloging with Atlan, and supplied the data behind four Tableau reports. Advertisers, finance and business teams now work from automated, consistent campaign and financial reporting.
Project Context
The client delivers healthcare advertisements and tracks how patients engage with them. Raw data came from an ad engine (Kevel Ad Engine) and the client’s own portals, and included impressions, clicks, ad placements, tokenized patient metadata and campaign details. Teams managed this data, analyzed ad performance and produced reports using Excel spreadsheets.Product information at the client lived in many places: SAP ECC instances across regions, an R&D data lake, SharePoint files with supplier packaging data, and product specification systems. Each source served its own team. Together, they made it hard to see how a product's components, materials, formulas and market data connect.Fintech Evolution had reached a point where legacy banking infrastructure was limiting product velocity, scalability, and operational efficiency. Years of incremental changes had created tightly coupled services, increasing deployment complexity and slowing the introduction of new financial products.This project was part of a major judicial modernization initiative aimed at improving transcription accuracy and turnaround time across courts handling multilingual proceedings.
As data volumes grew, the approach became harder to manage. It was time-consuming, prone to errors and limited in what it could reveal. The client set out to move to a data-driven, automated approach. Zenithive designed and delivered the data engineering foundation for it: cloud ingestion and storage, a layered warehouse, automated orchestration, cataloging and lineage, and curated data for Tableau reporting.
Objectives & Success Criteria
Business Objectives
- Replace manual spreadsheet work with automated data collection and analysis for targeted healthcare advertising.
- Improve the accuracy and efficiency of ad performance measurement.
- Support patient engagement through personalized advertisements.
- Give sponsors and business teams comprehensive insights for informed decisions.
Technical Criteria
- Land raw data from the ad engine and client portals in scalable cloud storage.
- Load it into Snowflake automatically, with schema changes and incremental updates handled by the pipeline.
- Transform raw data into clean, analytics-ready models using DBT.
- Orchestrate workflows and alert teams to job failures or data anomalies.
- Version-control and deploy transformations through CI/CD, and provide catalog and lineage visibility.
Key Challenges
Excel at the Center of Reporting
Patient and ad performance data was handled in Excel. Large volumes were inefficient to manage, and as data grew, multiple files became hard to keep consistent.
Shallow Analysis, Slow Turnaround
Manual processing supported only basic analysis. Compiling, cleaning and analyzing data by hand took significant time and effort.
Delayed Insights & Human Error
Manual reporting delayed access to performance metrics, which made it difficult to optimize campaigns. Manual handling also increased the risk of mistakes and inaccurate insights.
Solution Overview
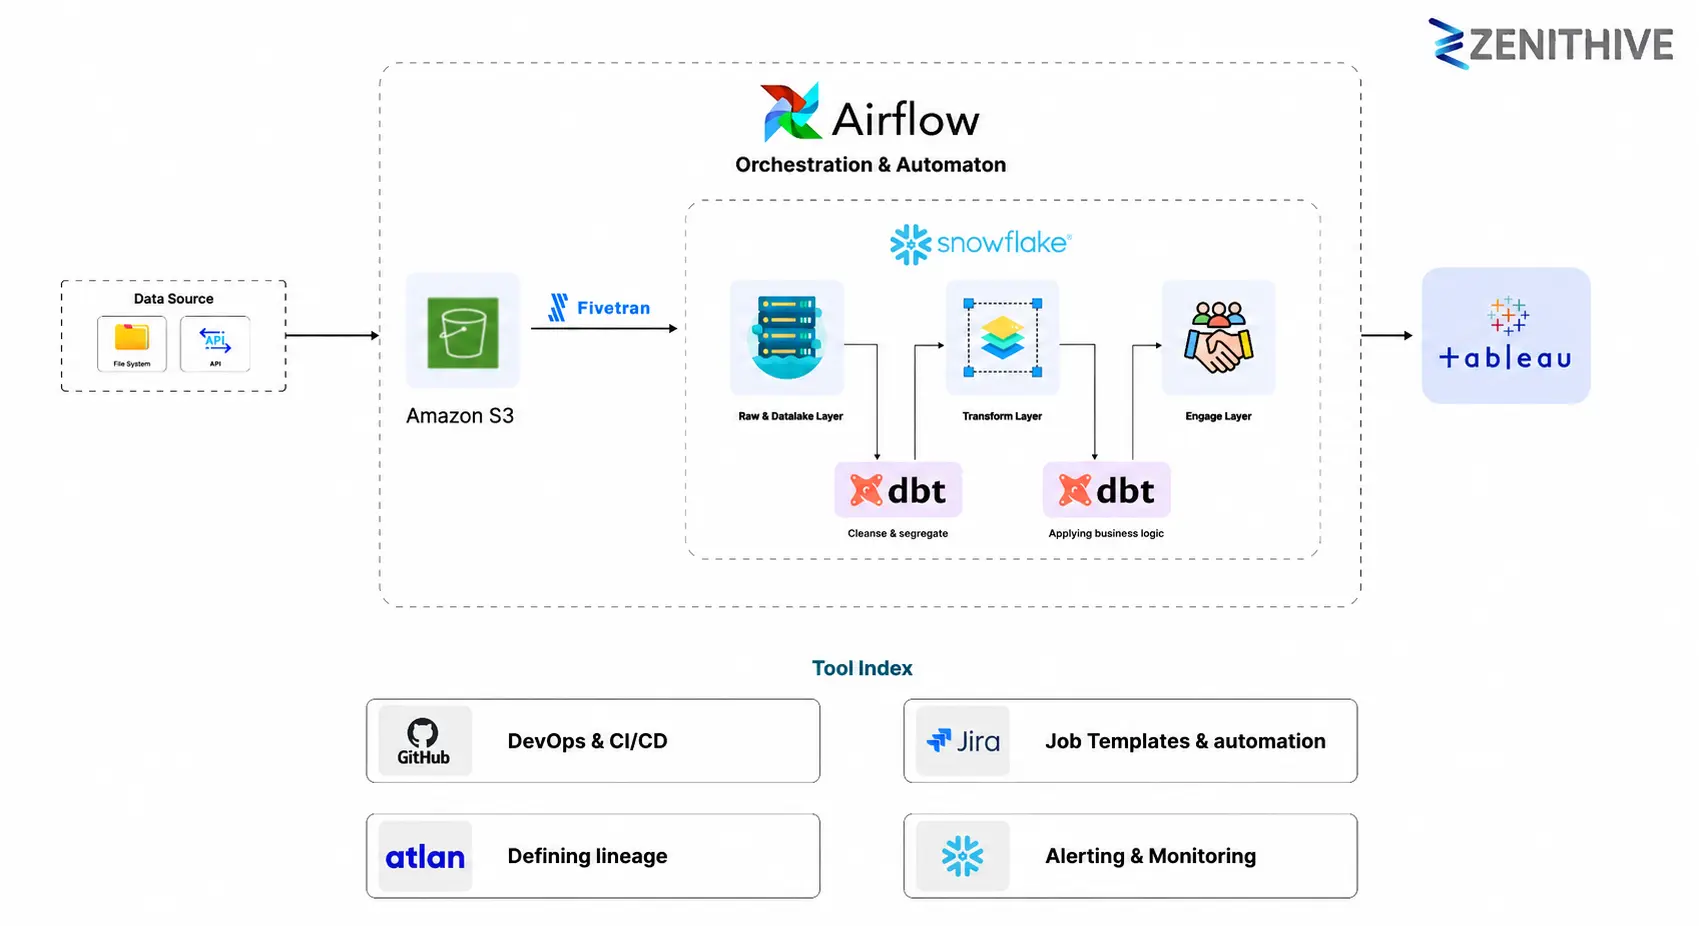
Zenithive built the platform on AWS S3, Fivetran and Snowflake. Raw data from the ad engine and client portals lands in S3, which acts as the primary data lake. Fivetran loads it into Snowflake, where data moves through three layers: Raw & Datalake, Transform and Engage. DBT cleanses and structures the data, then applies business logic. Airflow, managed by Astronomer, schedules and coordinates every step. Tableau dashboards draw on the structured data in Snowflake, and Atlan provides cataloging and lineage.
Systems Components & Capabilities
Ingestion & Storage
Databricks pipelines move data from L0 to L1 and L2. The team used PySpark, SQL and Python at L2 to prepare data for BI.
Automated Loading
The team connected Databricks to source systems through a Service Principal and mount points.
Snowflake Data Model
A three-layer structure organizes processed data into Raw, Core Integration and Core Access. Pipelines load data using truncate-and-load and overwrite methods.
DBT Transformations
Airflow DAGs trigger data movement and transformations. The team implemented DBT for transformation workflows and CI/CD within the Data Covers framework.
CI/CD with GitHub
Alerting built on Data Quality Index (DQI) rules for accuracy and coverage flags data quality issues.
Orchestration & Alerting
Power BI dashboards use Core Access data to show marketplace trends, supply chain analytics and material sourcing.
Orchestration & Alerting
Airflow DAGs run ingestion, transformation and reporting loads in sequence and send notifications when jobs fail or anomalies appear.
Governance & Lineage
Atlan catalogs data assets and tracks lineage from ingestion to reporting, so analysts and business users can discover, document and trace data.
Business Intelligence
Tableau dashboards give business teams interactive views of ad performance, engagement and financial reporting.
Delivery Tracking
Jira boards tracked sprint planning and each development, transformation and deployment task.
Airflow Pipeline Orchestration
Airflow DAGs run the pipeline as a defined sequence. Each run ingests data from AWS S3 into Snowflake through Fivetran, runs DBT transformations to clean and model the data, loads the transformed data into the reporting layer, and sends notifications if a job fails or an anomaly appears.
Failure alerts notify the team of job failures or data anomalies, which supports monitoring and helps limit downtime.
Data Model
Data moves through three layers in Snowflake: Raw & Datalake, Transform and Engage. Event, patient, campaign and ad models are built up layer by layer, and the Engage layer serves the reports.
Technology Stack & Tools
Ingestion
Fivetran
Data
Snowflake
Transformation
DBT
Orchestration
Apache Airflow
BI & Delivery
Tableau
Governance
Atlan
DevOps & delivery
Git Hub
Jira
Cloud storage
AWS S3
Execution Approach
Phase 1: Data Ingestion & Storage
Landed raw data from the ad engine and client portals in AWS S3, then set up Fivetran to load it into Snowflake with automated schema detection, metadata retention and incremental updates.
Phase 2: Data Transformation & Processing
Built DBT models in Snowflake to create the cleaned data zone, apply business logic for ad performance tracking and optimize query performance. Put the models under version control with GitHub Actions CI/CD for testing, deployment and schema change tracking.
Phase 3: Orchestration & Automation
Configured Airflow DAGs to run ingestion, transformation and reporting loads in sequence, with failure and anomaly alerts.
Phase 4: Visualization & Governance
Provided transformed data to Tableau developers and worked with them to optimize queries and keep Snowflake and Tableau figures consistent. Integrated Atlan for cataloging and lineage, and tracked all work in Jira.
Results & Business Impact
From Spreadsheets to an Automated Pipeline
Ingestion, transformation, orchestration and reporting loads now run as automated, scheduled steps, replacing manual compiling and cleaning in Excel.
Consistent Performance and Financial Reporting
Standardized ad performance and financial tracking give teams one consistent view and greater transparency.
Timelier, More Reliable Insight
Automated refreshes and failure alerts replace manual reporting cycles, so teams reach campaign metrics sooner and learn quickly when a job fails.
Traceable Data
Atlan’s catalog and lineage help analysts and business users find data and trace how it flows from ingestion to reporting.
A Foundation Built to Scale
Cloud storage, a layered warehouse and modular DBT models give the platform a structure that can handle growing data volumes without the file sprawl of spreadsheets.
Key Learnings
Automate the Handoffs
Running ingestion, transformation and alerting as one orchestrated sequence removed manual steps between systems and made the pipeline easier to operate.
Governance Works Best Alongside the Pipeline
Cataloging and lineage in Atlan, introduced as part of the build, made it easier to discover data and trace changes across the pipeline.
Engineers and BI Developers Deliver Better Together
Close collaboration between data engineers and Tableau developers on queries, consistency and ad hoc analysis kept dashboards fast and aligned with the data in Snowflake.
Delivery Team
Zenithive deployed a 5-member team over 12 months. Roles: Solution Architect, two Data Engineers, Data Analyst, Project Manager.
Related Capabilities

Healthcare advertising data is never just about dashboards. It’s about decisions teams can trust.
If you’re replacing spreadsheet reporting with an automated data platform, let’s compare contexts.
Frequently Asked Questions
How long does a project like this take, and who works on it?
This project ran for 12 months with a team of five: a solution architect, two data engineers, a data analyst and a project manager. Timelines for other projects depend on the number of sources, the data complexity and the reporting needs.
Why replace Excel-based reporting with a cloud data platform?
Spreadsheets became hard to manage as data volumes grew. They were slow to compile, prone to errors and limited to basic analysis. In this project, AWS S3, Fivetran, Snowflake, DBT, Airflow and Tableau automated the path from raw data to reports.
How does Fivetran move data from AWS S3 into Snowflake?
Fivetran extracts data from S3 and loads it into Snowflake. It detects schema changes automatically, keeps the metadata needed downstream, and fetches only new and updated records, which removes manual steps from data movement.
How does DBT fit into this workflow?
DBT builds modular SQL transformations inside Snowflake. It cleanses and segregates raw data, then applies business logic for ad performance tracking. GitHub Actions tests and deploys the models and tracks schema changes with rollback.
How do you keep a pipeline like this running reliably?
Airflow DAGs run each step in sequence and send notifications when jobs fail or data anomalies appear. Atlan lineage helps teams trace data changes across the pipeline, from ingestion to reporting.
What does Atlan add to a data platform?
Atlan provides a data catalog and lineage tracking. Analysts and business users can discover data more easily, understand how it flows from ingestion to reporting, and rely on better metadata management for governance.